
Harvest Timing and Coffee Quality: A Producer's Guide

Harvest timing is the single most decisive variable in coffee quality. Pick a cherry too early and the cup turns green and astringent. Pick it too late and fermented, boozy notes take over. Get it right and you unlock the sweetness, acidity, and aroma that specialty buyers pay premiums for. The practical verdict: if specialty scores or premium prices are your goal, prioritize selective picking backed by active field monitoring. If you run large-scale mechanized operations, invest in post-harvest sorting infrastructure to recover what mixed-ripeness lots cost you. Post-harvest operations contribute about 60% of green coffee quality in some literature reviews, but that figure assumes the cherries arriving at the mill were picked at the right time. No amount of processing skill fully reverses a mistimed harvest.
The Specialty Coffee Association’s (SCA) specialty grading threshold is set on a 100-point scale, and differences in scores often trace back to the farm, not the roaster. The Flaming Bean sources with that reality in mind, working with producers who treat harvest timing as a quality control step, not just a labor scheduling task.
Table of Contents
- How does cherry maturation change bean chemistry and cup quality?
- What ripeness indicators should you measure before picking?
- Which harvest method fits your farm and quality goals?
- How does harvest timing interact with your processing method?
- How do climate, altitude, and variety shift your optimal harvest window?
- What does harvest timing cost you in operations?
- A field monitoring checklist and sample log you can use today
- Key Takeaways
- Why harvest timing is the most underrated sourcing variable
- Taste what careful harvest timing actually produces
- Useful sources for producers and processors
How does cherry maturation change bean chemistry and cup quality?
Cherry ripening is a cascade of chemical changes, and each stage leaves a fingerprint in the cup. Understanding that pathway is what separates producers who monitor from producers who guess.
The chemistry of ripening
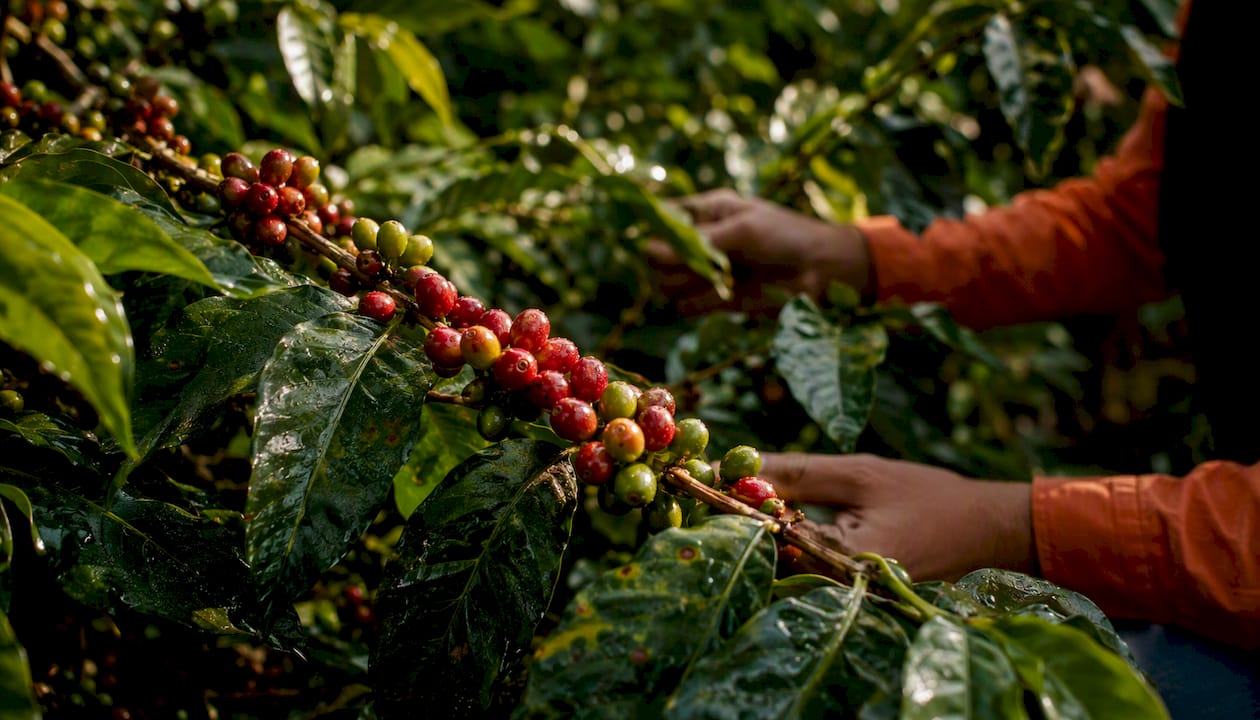
As a coffee cherry moves from green to fully ripe, several things happen simultaneously. Sugars accumulate, measured as Brix (degrees of dissolved solids), and those sugars feed fermentation during processing and Maillard reactions during roasting, producing sweetness and caramel-like depth. Organic acids shift: malic and citric acid concentrations change through maturation, shaping the cup’s perceived brightness and balance. Moisture content drops as the cherry ripens, concentrating flavor precursors inside the bean. Volatile aromatic compounds, the precursors to floral and fruity notes, develop in the final weeks before peak ripeness. Chlorogenic acid (CGA) levels also shift during maturation; research published in PMC confirms that harvesting period and cultivar together significantly affect these chemical profiles in the final cup.
From chemistry to the cup
Those chemical changes map directly to sensory attributes:
- Sweetness rises with sugar accumulation in fully ripe cherries.
- Acidity becomes cleaner and more pleasant as organic acid profiles stabilize at peak ripeness.
- Body increases with bean density, which correlates with longer, slower maturation at altitude.
- Aroma depends heavily on volatile precursor development in the final ripening stage.
- Defect risk spikes at both extremes of the ripeness window.
Common defect pathways from mistimed harvests:
- Underripe (green) cherries: vegetal, grassy, astringent notes; harsh finish; high CGA content that survives roasting as bitterness.
- Overripe cherries: fermented, boozy, or vinegary notes; soft body; elevated acetic acid from spontaneous fermentation on the tree.
- Dropped or ground-contact cherries: mold, riado (potato defect in some origins), and musty off-flavors from fungal activity.
“The harvesting period is one of the most critical factors affecting the chemical composition of coffee beans, with measurable effects on chlorogenic acids, caffeine, and volatile precursors that directly determine sensory quality.” — PMC research on harvesting period effects
Brazil’s 2026 season illustrated the cost of timing disruptions at scale. Rain delays slowed picking and drying across Minas Gerais, increasing mechanical-harvest losses and triggering localized mold and fermentation in early-season lots. Market analysts at Itaú BBA and Safras linked the slower harvest pace directly to price volatility and observed grading declines. The chemistry was fine in the tree. The timing failure happened in the field.
What ripeness indicators should you measure before picking?
Color is the most visible ripeness cue, but it is also the most unreliable one used alone. Cherry color varies by variety: Catuaí turns red at peak ripeness, while Yellow Bourbon turns golden yellow. Relying on color without cross-checking with physical and chemical measurements leads to mixed-ripeness lots even on farms with careful pickers.
Field guides and grower resources consistently recommend combining visual checks with refractometer readings and sample cuppings rather than using color alone. Here is a repeatable field sampling protocol:
Field sampling protocol
- Select sample trees. Choose at least 10 trees per block, distributed across the block’s topography (high, mid, low slope). Mark them for consistent re-sampling.
- Pull 50 cherries per tree. Take cherries from multiple branches at different heights, not just the easiest-to-reach ones.
- Visual sort. Separate into green, yellow/turning, red/ripe, and overripe. Record the percentage of each category. Target a high percentage of ripe cherries before committing a block to harvest.
- Brix check. Crush 10–15 ripe cherries and read the juice with a handheld refractometer. Example target range: 18–22 °Brix for Arabica at peak ripeness (treat these as orientation thresholds; actual targets shift by variety and altitude).
- Float test. Drop a handful of depulped beans in water. Floaters (low-density beans) indicate underripe or defective material. High float rates signal the block needs more time.
- Firmness check. Squeeze a ripe cherry between thumb and forefinger. It should yield with slight resistance, not feel hard (underripe) or mushy (overripe).
- Sample cupping. Pull a small lot from the block, process it quickly, and cup it 24–48 hours later. This is the ground truth that no instrument replaces.
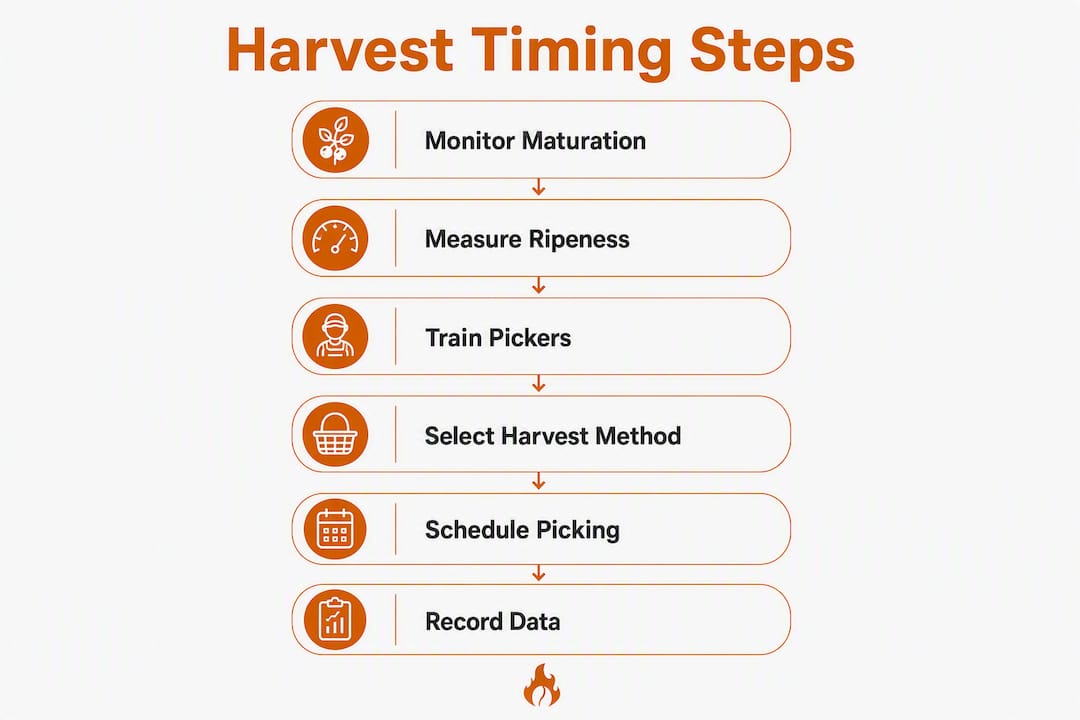
- Record and decide. Log date, block ID, % ripe, Brix average, float rate, and cupping notes. Compare against your target thresholds before authorizing harvest.
Pro Tip: Train pickers to squeeze and feel density before pulling a cherry, not just look at color. A picker who can identify a dense, fully ripe cherry by touch will consistently outperform one who picks by color alone, especially on varieties with subtle color transitions. Incentivizing pickers by weight without this training pushes immature green berries into the lot.
Which harvest method fits your farm and quality goals?
The right harvest method is not a universal answer. It depends on your farm’s topography, labor availability, processing capacity, and the market you are selling into. Producers should evaluate harvest decisions against farm-specific factors rather than apply blanket judgments about hand versus mechanized harvesting.
The three main approaches
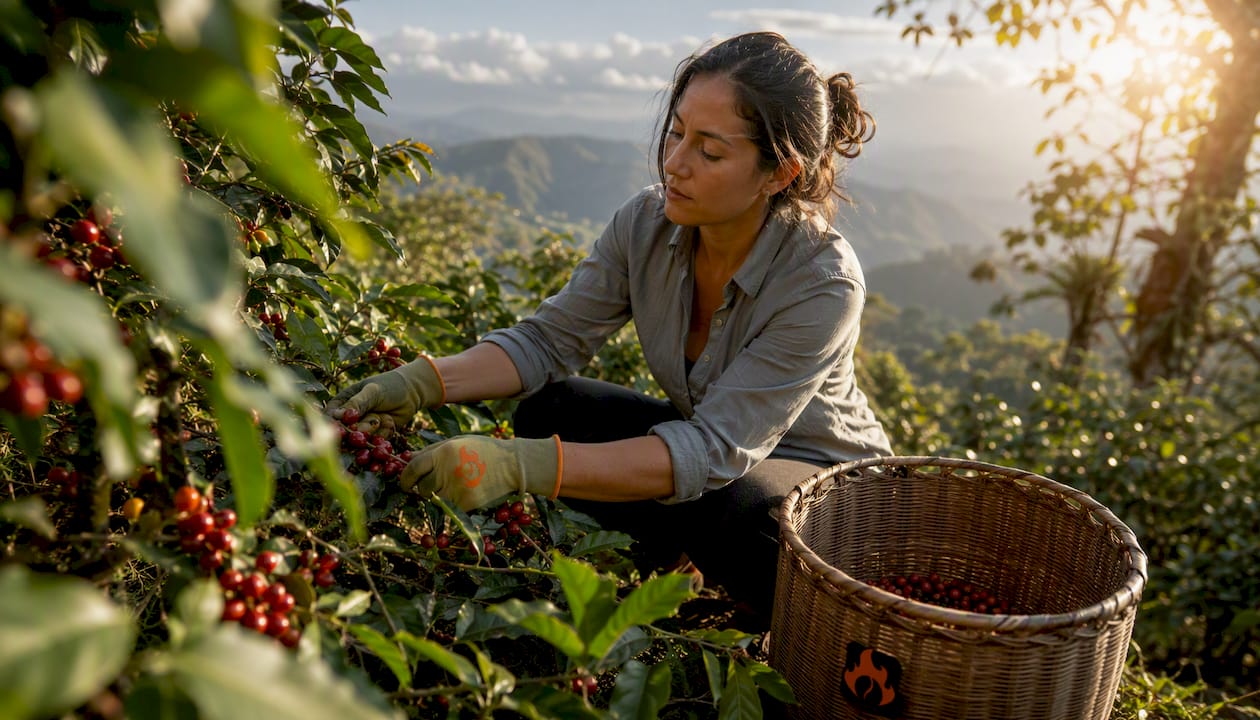
Selective hand-picking targets only ripe cherries in each pass. Pickers return to the same trees every 8–10 days, though that interval is a guideline, not a fixed rule. Selective picking yields higher cherry uniformity and correlates with reduced sensory defects and superior cup scores compared with bulk methods. It fits small-to-medium farms targeting specialty grades, steep terrain where machines cannot operate, and high-value lots where labor cost is justified by price premiums.
Strip harvesting removes all cherries from a branch in a single pass, regardless of ripeness. It is fast and labor-efficient but produces mixed-ripeness lots that require aggressive sorting downstream. Strip harvesting suits farms where labor windows are short, terrain is accessible, and the buyer accepts commercial-grade lots.
Mechanized harvesting uses vibrating rods or harvesting machines to strip cherries at scale. It dominates large, flat Brazilian estates. Speed is the advantage. Mixed ripeness, ground contact losses, and higher defect rates are the trade-offs. Optical sorters processing 6,000–10,000 kg of cherries per hour can partially offset mixed-ripeness lots, but at added capital and operating cost.
| Dimension | Selective hand-picking | Strip harvesting | Mechanized harvesting |
|---|---|---|---|
| Labor intensity | High | Moderate | Low |
| Cherry uniformity | High | Low | Low–moderate |
| Defect risk | Low | High | High |
| Speed | Slow | Fast | Very fast |
| Specialty grade potential | High | Moderate | Low–moderate |
| Post-harvest sorting need | Low | High | High |
| Terrain suitability | All, including steep | Flat to moderate | Flat only |
Scheduling: monitor, don’t calendar
The 8–10 day return interval for selective picking is a practical starting point, not a rule to follow blindly. Weather, pest pressure, and varietal behavior all compress or expand the optimal window. During Brazil’s 2026 rains, farms that stuck to fixed schedules saw cherries drop and ferment on the tree before pickers returned. Farms that monitored daily and adjusted their rounds protected more of their crop. Treat the interval as a monitoring target and let field data drive the actual decision.
How does harvest timing interact with your processing method?
The same cherry ripeness level plays out very differently depending on whether you send it through a washed, natural, or honey process. Timing decisions made in the field set the conditions your processing team has to manage.
Washed (wet) process is the most sensitive to underripe cherries. When green or turning cherries enter the depulper, their lower sugar content produces thin, underdeveloped fermentation. The result is a grassy, harsh cup with elevated astringency. Washed lots benefit most from tight ripeness windows because the process strips away the cherry’s protective layers quickly, leaving the bean’s chemistry exposed.
Natural (dry) process carries the opposite risk. Overripe cherries ferment aggressively during drying, producing boozy, vinegary, or barnyard notes that overwhelm the fruit-forward character the process is meant to highlight. Natural lots need cherries at peak ripeness, not past it, and they need immediate attention to drying conditions after harvest.
Honey and semi-washed processes sit between the two. Partial mucilage retention means the fermentation environment is more variable. Underripe cherries produce insufficient mucilage for the honey effect; overripe cherries create excessive fermentation that turns the honey layer into a defect source.
Practical adjustments by process:
- Washed: If ripeness uniformity is below target, shorten fermentation time to reduce acid development from underripe material. Sort aggressively before the tank.
- Natural: If overripe cherries enter the drying bed, spread them in thinner layers and increase turning frequency to manage fermentation heat. Separate overripe lots immediately.
- Honey: Match mucilage retention percentage to ripeness level. Riper cherries can handle higher mucilage retention; less-ripe material should be processed closer to washed to avoid off-flavors.
Pro Tip: Have your processing team record the day’s ripeness percentage and Brix average at intake. Use that data to set the fermentation SOP for that specific lot, not a standard protocol applied to every intake. A lot at 90% ripe and 20 °Brix needs different handling than one at 75% ripe and 16 °Brix.
How do climate, altitude, and variety shift your optimal harvest window?
There is no universal harvest calendar. The right timing depends on where your farm sits, what variety you grow, and what the season has thrown at you. Understanding how these variables interact lets you adapt your monitoring rather than follow someone else’s schedule.
Altitude is the biggest single modifier of maturation speed. Higher elevation means cooler temperatures, slower cherry development, and more time for sugars and aromatic precursors to accumulate. High-altitude Arabica (above 1,500 meters) often has a longer maturation window, which is part of why it tends to produce more complex cup profiles. Harvest timing research confirms that altitude-driven maturation differences produce measurable changes in chemical composition and sensory outcomes. Lowland farms ripen faster and require more frequent monitoring because the window between peak ripeness and overripe is shorter.
Key altitude-related considerations:
- High-altitude farms (above 1,500 m): Longer maturation, more complex flavor development, wider harvest window, but greater weather exposure risk.
- Mid-altitude farms (1,000–1,500 m): Moderate maturation speed; standard monitoring protocols apply.
- Lowland farms (below 1,000 m): Fast maturation, narrow peak window, higher risk of overripe cherries if monitoring lapses.
Variety changes both the color cues and the ripeness thresholds. Yellow varieties (Yellow Bourbon, Yellow Catuaí) reach peak ripeness at a golden-yellow stage that inexperienced pickers often mistake for underripe. Red varieties (Red Catuaí, Caturra) are more intuitive but still vary in the exact shade that signals peak Brix. Gesha and other long-fruited varieties have different firmness profiles at peak ripeness. Calibrate your color charts and Brix targets to your specific variety, not a generic Arabica standard.
Microclimate variability within a single farm can shift harvest timing by one to two weeks between blocks at different elevations or aspects. Dynamic monitoring, including daily observation of color, firmness, and moisture, is the only reliable response to weather-driven harvest shifts. Block-level sampling logs make this manageable.
What does harvest timing cost you in operations?
Agronomic decisions become financial decisions the moment pickers enter the field. Here is how timing choices translate into operational realities.
Harvest-day timeline that matters:
- Pick to delivery: Ripe cherries should reach the wet mill within 8–12 hours of picking. Longer delays, especially in heat, trigger spontaneous fermentation in the cherry.
- Delivery to pulping: Process within 12–24 hours of delivery. Holding tanks that sit overnight in warm conditions degrade quality fast.
- Pulping to drying: Move depulped beans to drying beds or mechanical dryers within 2–4 hours of pulping to prevent anaerobic fermentation.
- Drying window: Target 15–18 days on raised beds for washed Arabica, adjusting for weather and initial moisture content.
Cost trade-offs by method:
- Multiple selective rounds increase picker labor costs significantly but reduce defect rates, sorting labor, and the risk of downgraded lots.
- Single-strip or mechanized harvests reduce harvest labor but raise sorting costs, increase defect-related rejections, and can trigger price penalties from buyers.
- Optical sorting infrastructure offsets mechanization’s quality risks but requires capital investment that only makes sense at scale.
QA checklist for harvest days:
- Record block ID, picker team, and start/end time for each lot.
- Pull a ripeness sample at intake and log % ripe, Brix average, and float rate.
- Sort visibly defective cherries (overripe, damaged, ground contact) before pulping.
- Assign each lot to a specific drying zone and record initial moisture.
- Flag any lot with ripeness below 80% for separate processing and buyer communication.
Harvest timing also feeds directly into your pricing strategy. Lots with documented ripeness data, consistent Brix readings, and low defect rates are easier to sell at specialty premiums. Buyers who pay above commercial grade increasingly ask for harvest records as part of traceability. Quality standards and traceability documentation are becoming table stakes across the food supply chain, and coffee is no exception.
A field monitoring checklist and sample log you can use today
Good harvest decisions come from consistent data, not intuition. This section gives you a ready-to-use monitoring structure.
Daily field monitoring checklist:
- Walk at least two sample blocks per day during the pre-harvest window.
- Pull 50 cherries per marked sample tree and sort by ripeness stage.
- Record % ripe, % turning, % green, and % overripe for each block.
- Take Brix readings from 10–15 ripe cherries per block using a handheld refractometer.
- Note any signs of pest damage, disease, or weather stress on cherries.
- Compare today’s readings against the previous day’s log to track ripening pace.
- Make a go/no-go harvest decision per block based on your target thresholds.
Sample lot intake log:
| Field | Description |
|---|---|
| Intake date | Date cherries arrived at the mill |
| Lot ID | Unique identifier per block and pick round |
| % ripe at intake | Percentage of cherries visually assessed as fully ripe |
| Brix average | Average refractometer reading from 10–15 cherries |
| Moisture (%) | Initial moisture reading at intake |
| Defect count | Number of defective cherries per 100-cherry sample |
| Processing method | Washed / natural / honey assigned to this lot |
| Processor assigned | Team or station responsible for this lot |
| Notes | Any anomalies, weather events, or deviations from SOP |
Example decision in practice: A producer monitoring a mid-altitude Caturra block in late October recorded 72% ripe cherries and a Brix average of 16 °Brix over three consecutive days, with no upward trend. Rather than strip-harvesting on schedule, the team delayed by five days, re-sampled at 88% ripe and 20 °Brix, and harvested selectively. The resulting lot cupped at specialty grade. The five-day delay cost one additional monitoring visit. The alternative would have been a commercial-grade lot.
Roast date and post-harvest handling matter too, but they cannot rescue a lot that started with poor ripeness data. The monitoring log is where specialty quality is either protected or lost.
Key Takeaways
Harvest timing drives the chemical changes that determine sensory quality, defect rates, and specialty grade outcomes, and no amount of processing skill fully reverses a mistimed pick.
| Point | Details |
|---|---|
| Timing drives chemistry | Sugar, acid, and volatile precursor levels at harvest directly determine sweetness, acidity, aroma, and defect risk in the cup. |
| Monitor, don’t calendar | Use daily block sampling with Brix readings and ripeness percentages; treat the 8–10 day return interval as a guideline, not a fixed rule. |
| Method and process interact | Selective picking suits specialty goals; mechanized harvests need optical sorting. Match fermentation and drying SOPs to the day’s ripeness data. |
| Altitude and variety shift the window | High-altitude farms have longer maturation windows; calibrate color and Brix thresholds to your specific variety and elevation. |
| The Flaming Bean sources with timing in mind | The Flaming Bean selects coffees from producers who document harvest ripeness, enabling traceability from field to roast for products like Evening Roast and Safe Ground. |
Why harvest timing is the most underrated sourcing variable
Most conversations about coffee quality focus on roast profiles, processing methods, or origin stories. Harvest timing rarely gets the same attention, and that gap is where a lot of specialty potential quietly disappears.
The evidence is clear: the chemical composition of a coffee bean at the moment of picking sets a ceiling that nothing downstream can raise. A roaster can highlight what is in the bean, but cannot add sweetness or complexity that was never there. A processor can manage fermentation carefully, but cannot fix the astringency baked into an underripe cherry. The ceiling is set in the field.
What producers often underestimate is how narrow the peak window actually is, especially at lower altitudes and in variable weather years. Brazil’s 2026 season showed what happens when rain compresses that window and fixed harvest schedules fail to adapt. The farms that came through with quality intact were the ones running daily monitoring logs, not the ones following a calendar.
The other underrated factor is picker training. A monitoring protocol is only as good as the people executing it. Pickers incentivized purely by weight will fill their bags with whatever is easiest to reach. Pickers trained to feel density and recognize true ripeness by touch and color together produce dramatically more uniform lots. That training investment pays back in reduced sorting costs and fewer downgraded lots, not just in cup scores.
For producers targeting specialty buyers, the monitoring checklist in this guide is not a nice administrative addition. It is the operational foundation that makes premium pricing defensible.
Taste what careful harvest timing actually produces
Every cup of The Flaming Bean coffee starts with a sourcing decision grounded in exactly what this guide covers. We look for producers who document harvest ripeness, run selective picking programs, and match their processing SOPs to the day’s field data. That is not a marketing claim. It is the standard we hold because we know what mistimed harvests taste like, and we are not interested in serving that to you.
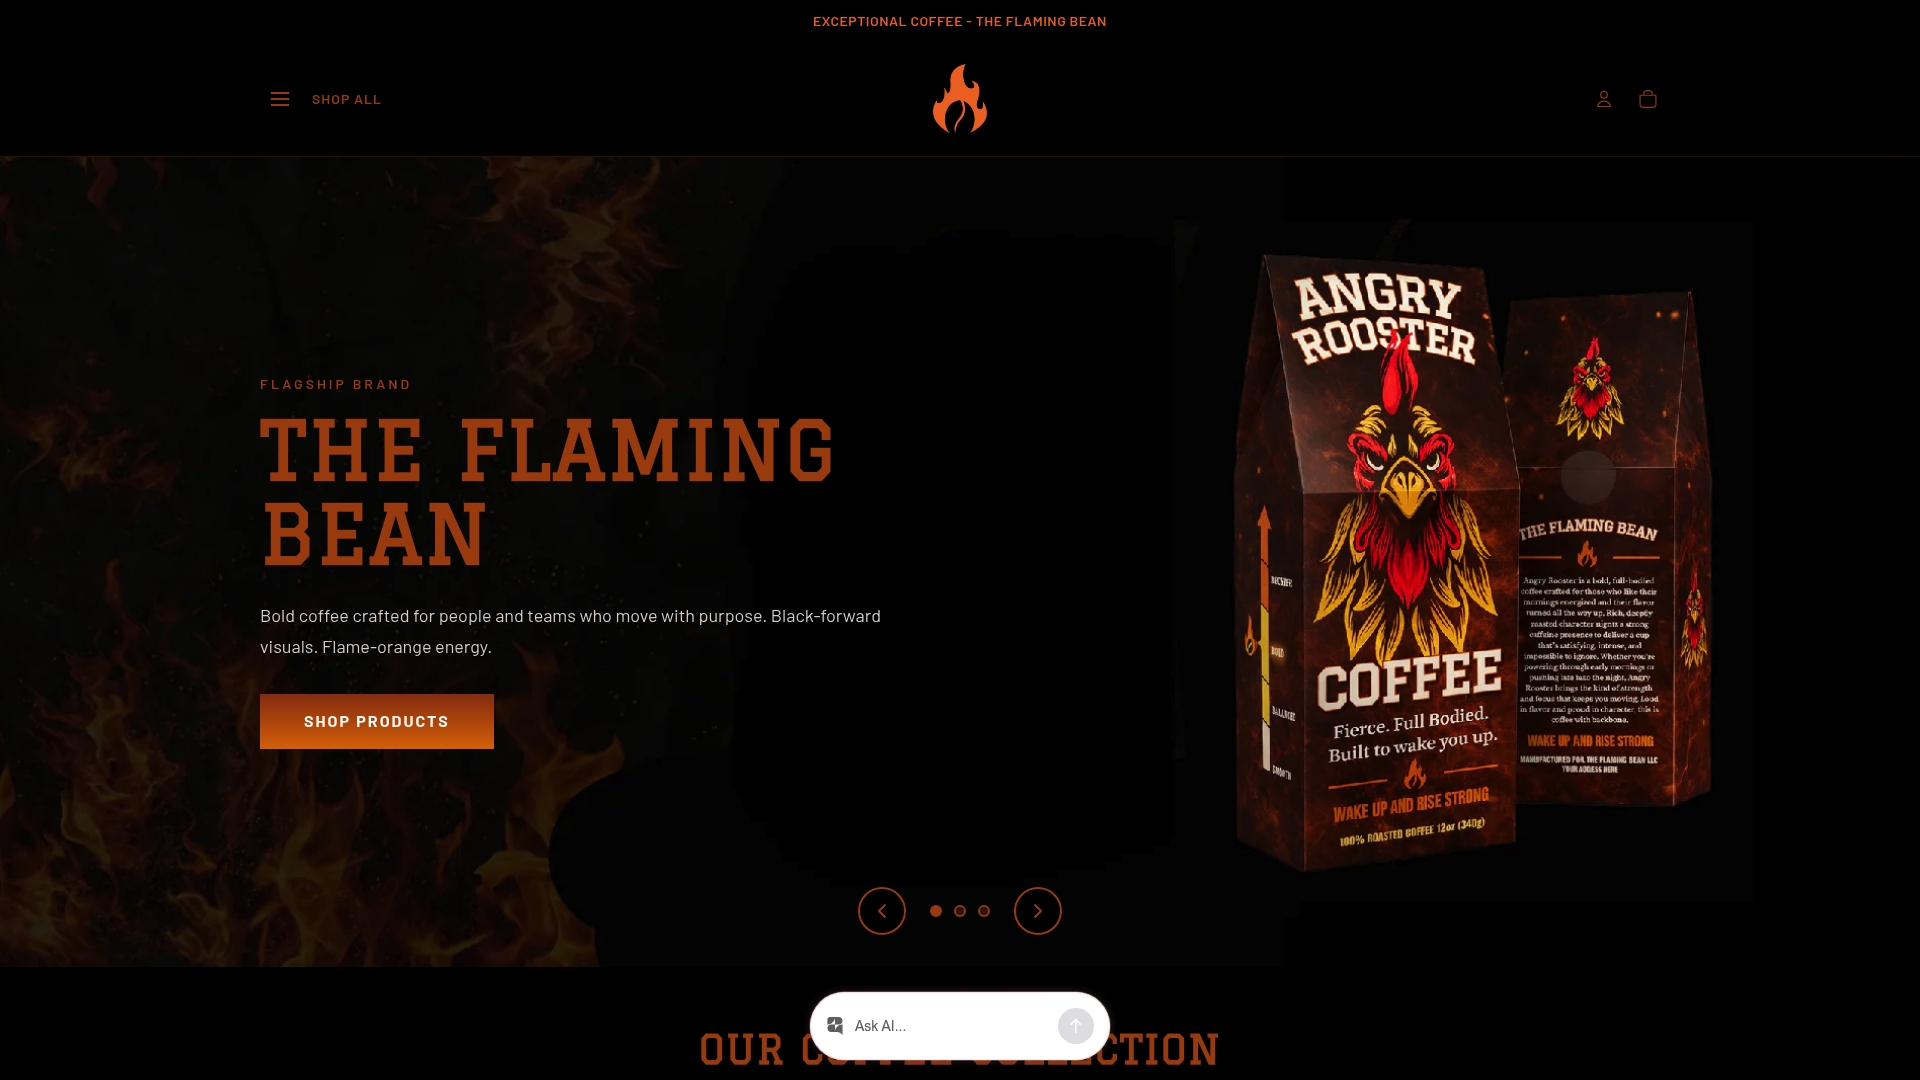
Two products that show what harvest-aware sourcing delivers: Evening Roast is built for smooth, approachable drinking, and the beans behind it come from lots with documented ripeness data and careful drying protocols. Safe Ground carries that same sourcing standard while supporting organizations protecting vulnerable communities. Both are available now. If you want to taste the difference that timing makes from field to cup, start there.
Useful sources for producers and processors
-
Effects of Harvesting Periods and Cultivar on Coffee Quality (PMC) — Peer-reviewed study confirming that harvesting period and cultivar together significantly affect chlorogenic acid profiles, caffeine content, and sensory outcomes. The most authoritative source in this guide for the chemistry-to-cup link.
-
The Harvest and Post-Harvest Management Practices’ Impact on Coffee Quality (IntechOpen) — Comprehensive chapter reviewing how post-harvest operations contribute to green coffee quality; supports the argument that timing must be matched to processing capacity.
-
Effect of Drying Airflows and Harvest Periods on Specialty Coffee Quality (Revista Bases de la Ciencia) — Field study from Ecuador examining how harvest period interacts with drying conditions to affect chemical composition; useful for producers managing both timing and post-harvest variables.
-
Selective Picking (Roastopedia) — Clear industry overview of selective picking protocols, return intervals, and the quality case for multiple harvest rounds.
-
When Is the Best Time to Pick Coffee Beans (Southern Cross Coffee) — Practical grower resource covering color, firmness, float tests, and Brix measurement as combined ripeness indicators.
-
Hand-Picked vs. Mechanized Coffee Harvesting (Perfect Daily Grind) — Balanced comparison of harvest methods with expert commentary on farm-specific decision frameworks.
-
Coffee Cherry Sorting (Perfect Daily Grind) — Covers optical sorting technology and how it can partially offset mixed-ripeness lots from mechanized harvests.
-
Harvesting Coffee Best Practices (Agriculture Institute) — Practical guidance on dynamic monitoring, picker training, and adapting harvest schedules to weather-driven changes.
-
Rain Delays Coffee Harvest in Brazil (Valor International) — 2026 season reporting on how rain delays increased mechanical-harvest losses and raised quality concerns in Minas Gerais.
-
Brazil Coffee Harvest Delays Fuel Price Swings (The AgriBiz) — Market-level analysis linking harvest pace and quality declines to futures volatility in Brazil’s 2026 season.
-
How Roasting Shapes Coffee Flavor Development (The Flaming Bean) — Internal resource explaining how roast development interacts with bean chemistry established at harvest; useful context for producers who want to understand how their timing decisions carry through to the final cup.
Recommended
- How to Evaluate Coffee Roaster Quality Like a Pro – The Flaming Bean Roastery
- How Soil Shapes Coffee Flavor: A Grower’s Guide – The Flaming Bean Roastery
- Why Some Coffee Tastes Chocolatey: A Flavor Guide – The Flaming Bean Roastery
- Find Coffee Matching Your Palate: A Flavor Guide – The Flaming Bean Roastery
Comments